A/B testing of packaging design
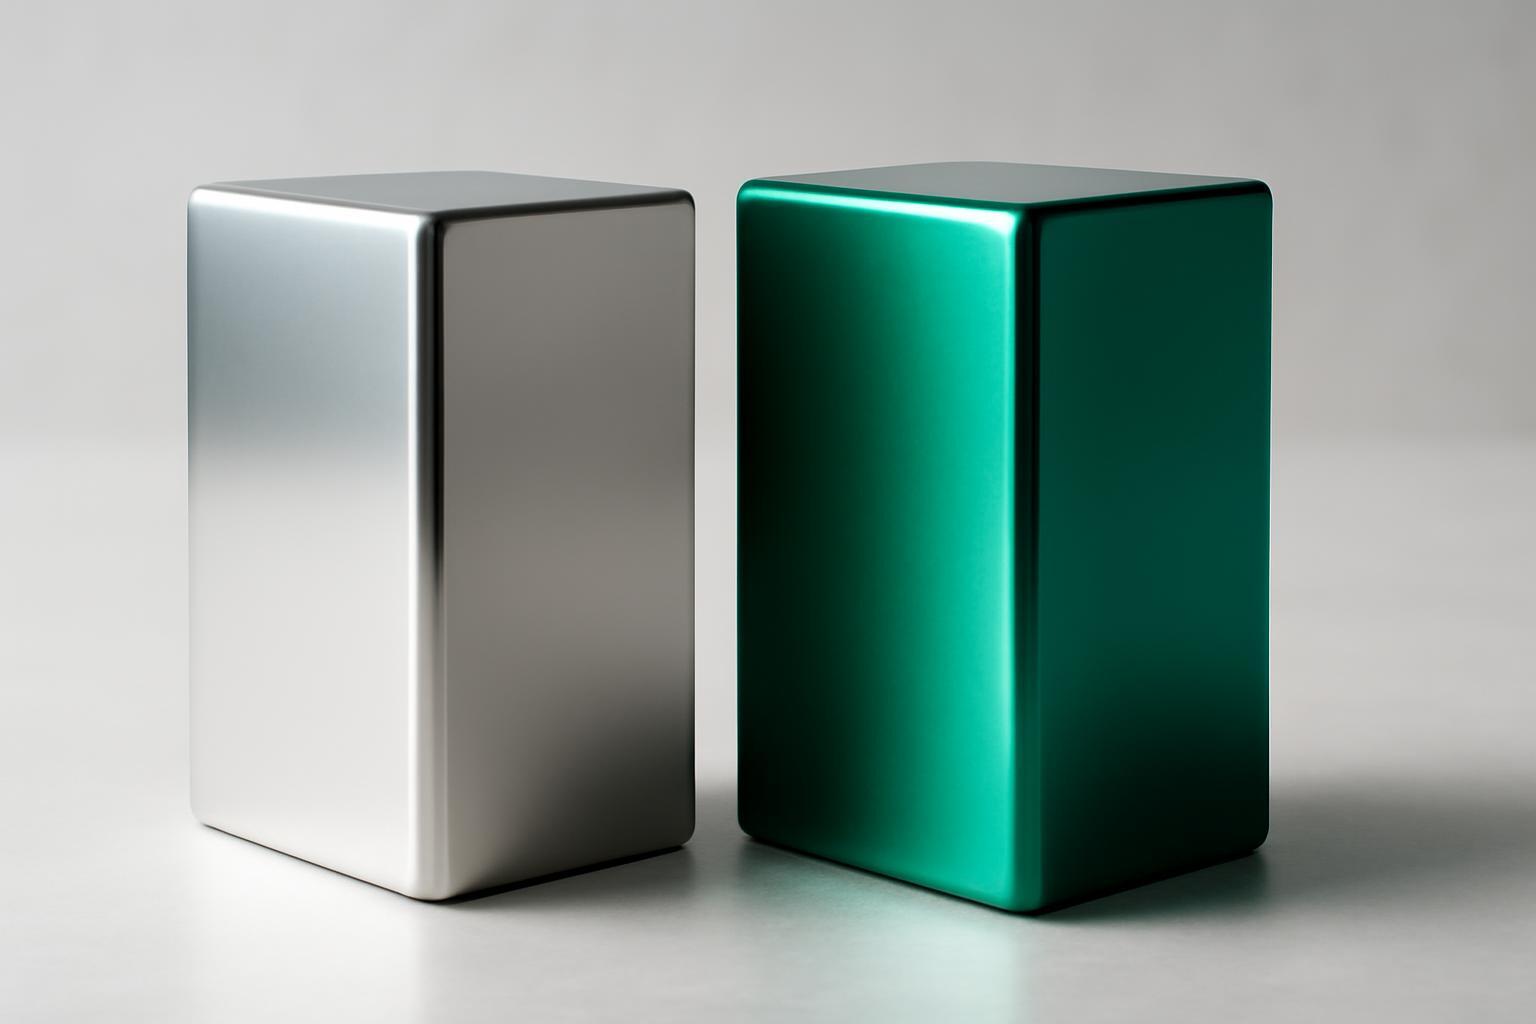
How to conduct a fair A/B test of packaging: step-by-step plan
The main mistake of most tests is trying to check everything at once: a new logo, a new palette, a new font, and a new bottle shape all at the same time. If sales have changed, no one will know what worked. The rule is simple: one test — one variable, split 50/50, all other parameters fixed.
- Formulate the hypothesis in the format: 'if we change X, then metric Y will increase by Z%, because...'. Without a reason, the hypothesis is weak and the result is hard to interpret.
- Choose one variable — background color, logo size, presence of a product photo, packaging shape.
- Create two strictly comparable versions — A (control, current packaging) and B (new version with one change).
- Choose the test format: physical (hall test, shelf in a real store) or digital (landing page, social media ads, marketplace listing).
- Define the success metric before starting the test, not after — otherwise there is a great risk of tailoring conclusions to a convenient result.
- Run the test for the required duration and with the required sample size (see below), and do not stop it prematurely due to early encouraging figures.
- Analyze not only 'which variant won,' but also why — through a survey of part of the sample.
Physical test vs digital
| Format | What it shows | Tools | When to use |
|---|---|---|---|
| Hall-test | Initial reaction, perception of quality, readability from a distance | Live shelf, stand, minimum 200 respondents | Before launching into production, when there is a large budget for a redesign |
| 3D-simulation | Appearance on the shelf and in hand without print run | Programs 3D-rendering, VR goggles | Early stage, saving on prototypes |
| Digital split-test on the website | Actual conversion to adding to cart and purchase | Google Optimize analogs, Shopify A/B apps, Optimizely | When the packaging is already on sale online |
| Test in social networks | Thumb-stop rate, CTR, engagement | Meta Ads Manager, TikTok Ads with separate creatives | Packaging verification as an advertising asset |
| Test on marketplace | Click-to-cart, conversion in product card | A/B tools Amazon (Manage Your Experiments), Ozon/Wildberries analytics | Products with high share of online sales |
Physical test shows emotional reaction more honestly, digital test shows real wallet behavior. Ideal methodology uses both: first, hall test or 3D-simulation filters out obviously weak variants, then the winner is tested on live online sales or pilot points.
Which metrics to choose depending on the goal
The error of 'testing everything in the same way with the same metrics' occurs in almost every company. The metric should answer the business question, not be a universal checkbox in the report.
| Business goal | Key metric | How to measure |
|---|---|---|
| Sales growth | Conversion to purchase, click-to-cart rate | Pilot sales points, digital split-test on real traffic |
| Brand recognition | Recognition speed, memorability after 24 hours | Survey with display for 1-2 seconds, test on delayed recognition |
| Perception of quality/premiumness | Willingness to pay, associations with words like 'expensive/quality' | Paired comparison with a price anchor, semantic differential |
| Effectiveness in social networks | Thumb-stop rate, CTR | Split creative testing in Ads Manager |
| Repeat purchases | Repeat rate, retention after first purchase | Cohort analysis by CRM over 30-90 days |
If the goal is sales, the attractiveness metric ('which option do you prefer more') is practically useless: it measures aesthetic preference, not purchase decision. These are different psychological processes.
Why 'shelf visibility' is deceptive
Here lies the most common marketer's misconception. Salience is the ability to attract attention, while conversion is the ability to turn that attention into a decision to put the product in the cart. The buyer makes the initial decision about the product within 500-700 milliseconds, and then spends 2-6 additional seconds deciding to pick it up. The package's task is not just to stand out among hundreds of competitors, but to land in those 6 positions and then convert attention into a purchase. It is at this intersection that many designs fail: a bright, attention-grabbing package gets into the field of vision, but looks cheap or unclear up close — and the buyer puts it back.
This is fixed through two-stage testing: first, it is measured whether the variant lands in the top 6 visually fixed products (a tachistoscope test with display in fractions of a second), then — what happens after the product is picked up: is the composition readable, is the price clear, does the material inspire trust. Companies that test both stages separately potentially double the conversion — from typical 17% to 30%, because they don't confuse 'saw it' with 'bought it'.
How many people and how much time are needed to believe in the result
A test on 20 respondents in a shopping center on Saturday is not research, but an anecdote. To ensure the result is not a random sample or seasonal spike:
- For a hall-test, at least 200 respondents are needed — this is the threshold at which differences between variants in the 5-7% range no longer constitute statistical noise.
- For a quality focus group (to understand 'why' and not 'how many'), 5-10 people are sufficient, but its results cannot be generalized to the entire audience — only used as hypotheses for a quantitative test.
- For a digital split-test, the sample size depends on the baseline conversion rate and traffic volume, but the overall duration should be 4-8 weeks to capture different days of the week, salary cycles, and random fluctuations in demand.
Stopping a test early upon seeing an 'obvious leader' on the third day is a typical cause of false conclusions. Early data is almost always skewed by the novelty effect.
Packaging as an asset of the digital funnel
Most packaging materials consider it an object that stands on a shelf and forget that for many brands it is today advertising creativity, a product card element, and a participant in email campaigns. DTC brand Native tested packaging as an element of the funnel: upon switching to a new design, 18% increase in website conversion, 22% improvement in CTR in email newsletters, and 31% growth in thumb-stop rate in Meta advertising were observed. These results were achieved through a comprehensive set of changes — design update, product photo change, hierarchy and contrast rework on the packaging.
This means that packaging needs to be tested at each stage of the digital funnel separately:
- Thumb-stop rate — does the packaging image stop scrolling in a social media feed (Ads Manager creative test with identical text and different packaging in the frame).
- Click-to-cart — does the product card with this packaging translate a click into adding to the cart on a marketplace or website.
- Repeat rate — does packaging (ease of opening, feeling upon reuse) influence the decision to buy again.
The asymmetry is that packaging that wins a physical hallway test may lose in a social media feed — on a 5x5 cm photo, completely different details matter: contrast, large font, readability on a small screen. Testing should be done separately for each channel, not automatically transfer offline test results to digital.
When packaging redesign pays off
A practical question that rarely makes it into articles: is it even worth spending money on a redesign if it costs more than the current packaging. Industry statistics show that a successful redesign on average yields +15% increase in sales — but only if it was tested on conversion, not on visual appeal. 72% of consumers, according to Ipsos data, admit that packaging design affects their purchase decision — so the potential is almost always there, the question is how to confirm it with numbers before investing in the run.
Simple ROI logic: if the new packaging costs 5% more to produce, but the A/B test on real traffic or pilot locations shows a conversion increase above 5% — the redesign pays for itself within the first sales cycle. If the increase is less — either the design needs to be refined, or a less expensive production solution must be found. Without this calculation, the decision on redesign becomes a matter of taste, not business.
Recent articles



MegaFon, BMW, VTB and more 240+ companies. See how it looks in the showcase reel:


Our branding agency is approached to order:
Branding agency services












