Brand color testing: A/B tests and focus groups
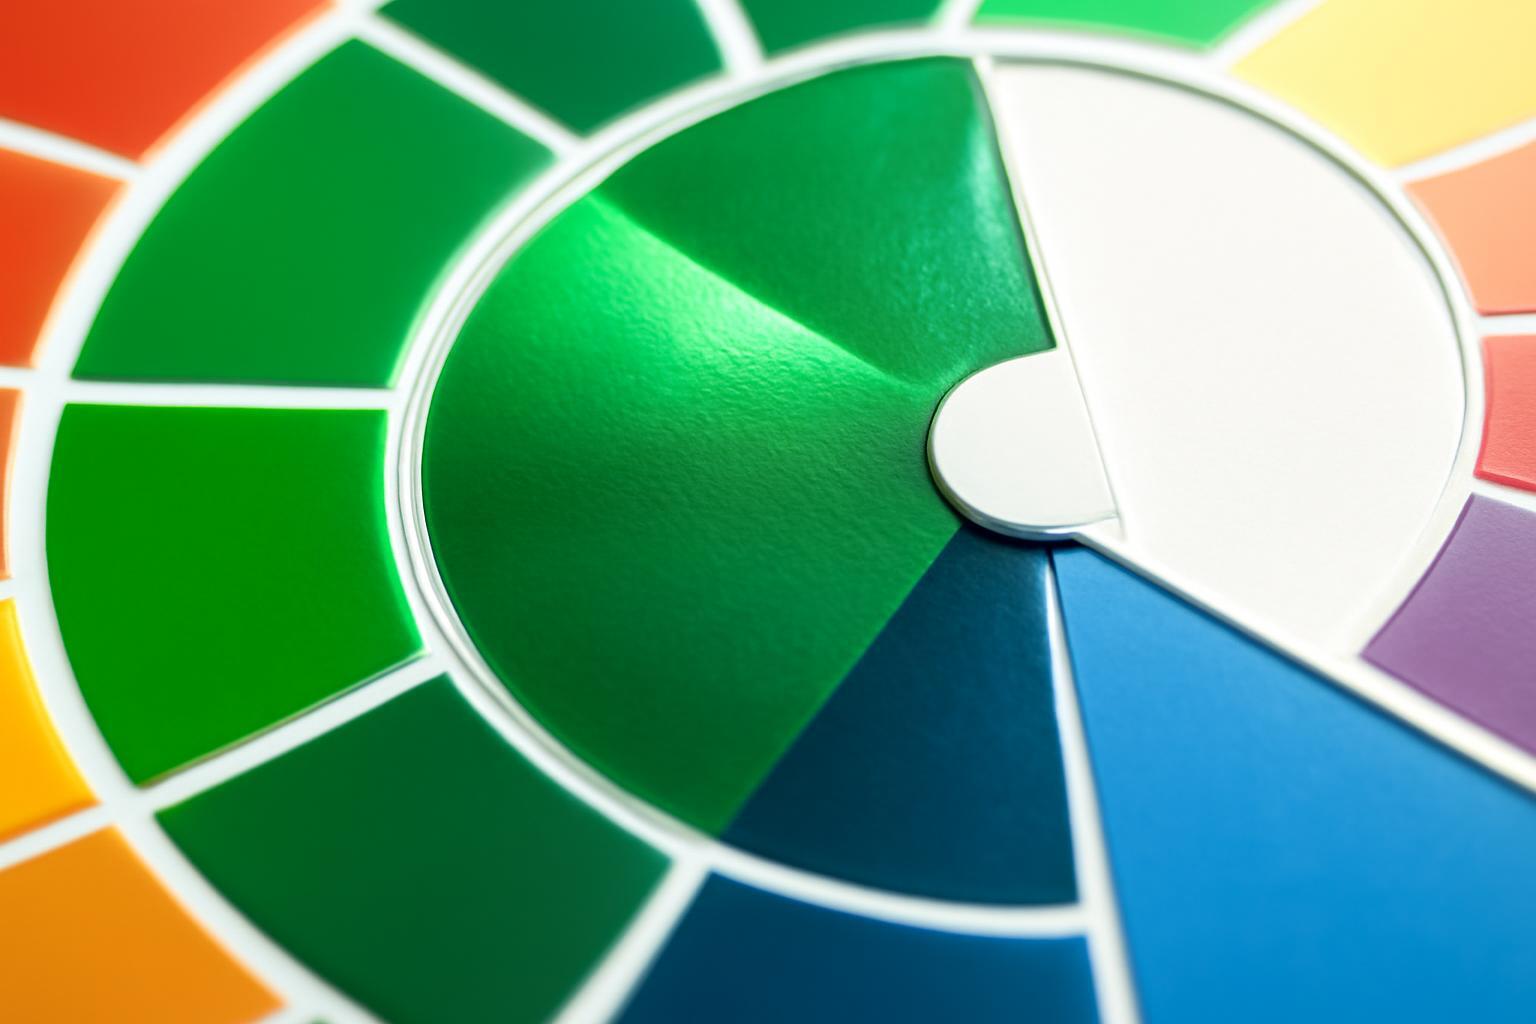
Why testing on a white background gives a wrong result
When a person is shown a logo or packaging separately, on a neutral background, the brain engages aesthetic evaluation: harmonious, modern, pleasant to look at. But at the store shelf, a completely different mode is activated — peripheral scanning. The eye first grabs the color spot from a distance of two to three meters, then the shape, and only in the last instance — details and text. These are two different cognitive processes, and the result of a 'slide test' does not predict behavior at the shelf.
According to the ZMET (Zaltman Metaphor Elicitation Technique) methodology, which is based on projective techniques rather than direct questions, research shows that consumers experience cognitive dissonance if the brand color looks different in various touchpoint locations — one shade on the packaging, another in the app due to the screen color profile. Such inconsistencies reduce the brand's effectiveness when transitioning between media. Hence, the practical rule is: any color test must be conducted on a mockup of the actual touchpoint — a photo of the shelf with competitors, a phone screen in hand, rather than a PDF presentation on a projector.
How to formulate questions so as not to receive a taste rating
"What color do you like more?" — this is a question that inevitably steers the conversation toward personal preferences of the moderator and the respondent, rather than toward purchasing behavior. The alternative phrasing sounds differently: "which of the two products would you grab faster if you were in a hurry" or "what would catch the eye if looking from a distance of two meters." This brings the respondent back into the role of a buyer, not an art critic.
Direct questions about emotions are also almost useless — "what do you feel looking at this blue" gives at best "calmness." Personalization works: "if this color were a person — who would it be and what would it do?" Answers like "strict accountant" or "creative friend who is always late" provide material that cannot be extracted with direct questions — they bypass the rational filter.
- Formulate questions through action, not through opinion: "what will you do" rather than "what do you think"
- Personification is a separate block of the guide, at least 10-15 minutes per group of 6-8 people
- Show options only in a realistic context: photo of a shelf, interface mockup, packaging in hand
- Record the response delay with a stopwatch — a long pause before making a choice is often more honest than the choice itself
Four levels of verification before launch
Launching a new color without completing all four levels is a bet, not a decision. Each level answers a specific question and does not replace the others.
| Level | What is checked | Tools |
|---|---|---|
| 1. Focus groups with personification | Emotional response and alignment with positioning | ZMET-guide, groups of 6-8 people |
| 2. A/B-test on real traffic or a batch of packaging | Actual conversion, not stated opinion | Optimizely, VWO — for the digit; test batch in 2-3 regional network — for packaging |
| 3. Eye tracking or heat maps | The trajectory and duration of gaze retention on the color | Tobii Pro, EyeQuant, RealEye; with a limited budget — Hotjar/Clarity as approximation for digital media |
| 4. Testing scalability | Readability from favicon to billboard | Rendering in 16×16 px, 180×180 px, billboard layout 3×6 m from 15-50 m distance; contrast per WCAG no lower than 4.5:1 |
It is important to measure memorability through 24 hours after presentation — this excludes random recognition caused by novelty. The threshold for a B2C-brand is higher than 65%, for B2B — higher than 45%. If the logo does not pass this, the problem is almost always in the color, not in the shape or font: people forget shapes faster than color spots.
Calculation of sample size for A/B color test
Here people make mistakes in both directions: some stop the test after three days upon seeing an 'obvious leader' in 40 clicks, others drag it out for months without a clear stopping criterion. Sample size is not a formality, but a condition without which the result is explained by randomness.
Example calculation: baseline conversion rate for a page or packaging — 5%, you want to detect an effect of +2 percentage points at a significance level of 95% and power of 80%. Using the formula for comparing two proportions, this gives approximately 3623 participants per variant — that is, more than 7000 people in total. A smaller sample will technically show a 'winner', but with a high probability of a Type I error.
The minimum test duration is two to four weeks, and here is why this is not over-precaution: you need to capture weekdays and weekends, impulsive and rational buyers, and also weather the effect of novelty — the first days of any new color attract attention simply because it is unfamiliar, and this distorts early statistics in its favor.
How to combine qualitative and quantitative stages into one cycle
The division of 'focus group or A/B test, choose one method' is a methodological error that occurs in most materials on this topic. These methods solve different tasks at different stages, and sequentially combining them reduces the risk of an expensive mistake after launch.
- Focus groups with persona narrowing the palette down to 2-3 variants that do not create dissonance with positioning
- A/B test on real audience checks the selected variants with sufficient sample size and duration of no less than two weeks
- Eye tracking or heat map objectively checks the winning variant — does it really hold the gaze longer than the competitor
- Scale verification — the final filter before printing the packaging or launching an advertising campaign
The cycle is more expensive than a one-time survey, but it is precisely this that separates the color that 'pleased the moderator' from the color that actually works on the shelf and in the interface.
What neuromarketing shows beyond basic color psychology
Red — energy and urgency, blue — trust, green — naturalness: this is a starting point, not a ready-made solution, and general articles stop here. The first impression of a brand is formed within 90 seconds of contact, and 60% of it is determined by color — the rest is supplemented by logo, font, and composition.
What comes next are things that color psychology itself does not explain. Generation Z shows 38% greater susceptibility to neon and saturated shades compared to millennials — if the brand's audience is getting younger, a calm muted palette may lose effectiveness simply due to the age shift in perception, not due to design quality. Instagram changed its icon to a gradient in 2016 and received a wave of negative feedback in comments and forums — people wrote that 'the design was ruined.' Behavioral metrics did not show a drop in app openings: verbal reaction and real action diverged. Eye tracking and heat maps capture exactly this divergence — a person may claim dislike of the moderator out of politeness or desire to look discriminating, but the gaze trajectory will show that they actually lingered on this color longer than on the competitor's variant. Neuromarketing tools should be used as a verification layer over focus groups, not as a replacement for them — both methods cover each other's blind spots.
Recent articles
MegaFon, BMW, VTB and more 240+ companies. See how it looks in the showcase reel:


Our branding agency is approached to order:
Branding agency services












